Jammu and Kashmir: Population Distribution, 1981 And 2001
The distribution of population in the area of the erstwhile princely state of Jammu and Kashmir is, to a very large degree, contingent on the factors of physical geography discussed in respect to the foregoing general reference map. Figure 3 provides a map of that distribution, by districts, as of 2001, the date of the most recent Indian census. Pakistan’s most recent census was taken in 1998 and we extrapolated district-level data for Azad Kashmir and the Northern Areas for that year, using the annual growth rates provided by the census, to derive the figures presented on the map and in the table below. Despite substantial growth over the period 1981-2001, the regional pattern of relatively high, medium, and low densities has altered little. In general, Indian-held Kashmir proper, Jammu, and Pakistani-held Azad Kashmir are areas in which densities range from medium to very high, while Ladakh and the Northern Areas are sparsely settled. Regional areas and their 1981 and 2001 population totals, as well as rates of population increase and 2001 population densities are indicated in the table below. At the district level, 2001 densities ranged from highs of 531 persons per square km. in Srinagar and 508 in Jammu to a low of only 2.6 in Leh.
| Region | Area (sq. km.)* |
Population 1981 (x 1,000) |
Population 2001 (x 1,000) |
% Increase (1981-2001) |
Density in 2001 (per sq. km.) |
| Indian-held areas | |||||
| Kashmir | |||||
| Jammu | |||||
| Ladakh | |||||
| Total | |
||||
| Pakistani-held areas
|
|||||
| Azad Kashmir | |||||
| Northern Areas | |||||
| Total | |||||
Chinese-held areas
|
|||||
| Aksai Chin | |||||
| Shaksgam | |||||
| Total | |||||
| Grand Total | |||||
| * To convert sq. km. to square miles, multiply by 2.59 | |||||
Over the period from the first post-partition census in 1951 to the 1981 enumeration the rate of population growth on the Pakistani side of the Line of Control was significantly higher than on the Indian side. However, if the figures provided in the table above are to be taken at face value, the reverse seems to be true for the period 1981-2001. The reasons for this are unclear. They may reflect any or all of the following: an increase in the rate of net emigration from Azad Kashmir and the Northern Areas; a net increase in the rate of immigration into those two regions (especially likely in regard to the Northern Areas since the completion of the Karakoram Highway); or the omission from the enumerated population in the Northern Areas of persons not native to the region (a hypothesis suggested by the remarkably low proportion of that population reported as speakers of non-local languages in the fragmentary languages available to us). In any event, the enumerated Northern Areas population in 1998 was substantially less than what we had formerly forecast based on demographic data provided in 1987 by the Aga Khan Rural Support Programme.
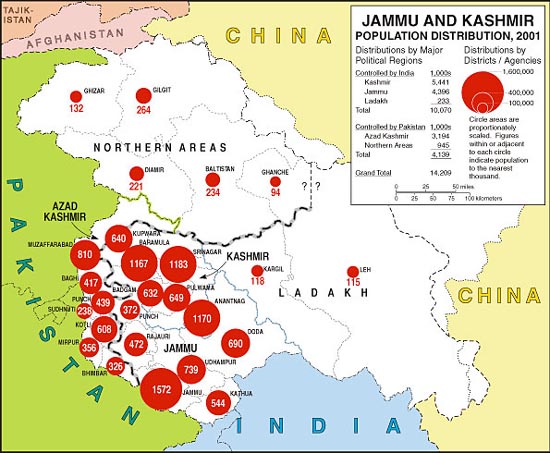
Figure 3: Jammu and Kashmir: Population
Distribution, 2001